Technical Details (Overview and methods)
0: Aims of the Project
Prefrontal cortex (PFC) is a frontal part of the cerebral cortex which participates in control of complex behaviors, including emotional and social behaviors, action planning, decision making etc. Its malfunction is associated with psychiatric disorders such as Alzheimer’s disease and frontotemporal dementia. The aim of the current project is to provide a detailed map of PFC connectivity with the whole brain using common marmosets as the model primate.
1: Experimental Overview (data production)
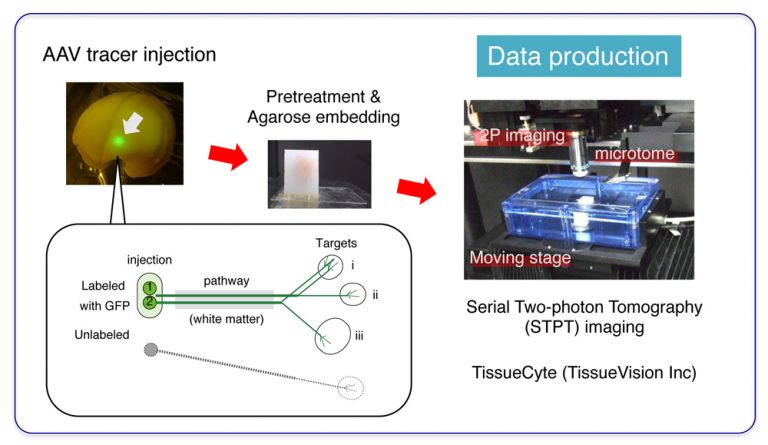
PFC connects with various brain regions, which provides the basis for its diverse function. To interrogate the connectivity, we injected “AAV tracer” to various positions within PFC of common marmosets. “AAV tracer” is a new generation of neuronal tracer, which exploits adenoassociated viral vector to transduce neuronal cells to produce a large amount of Green Fluorescent Protein (GFP) (see here for more detail). As a result of GFP production, the PFC neurons are labeled from the cells of origin to the tips of the axons where they make synaptic connections with the target neurons. You need a microscopic resolution (µm-order) to visualize single axon fibers. On the other hand, these axon fibers can extend as long as 1-2 cm. To image such fine structures for the entire brain, we employed Serial Two-photon Tomography imaging technique (Ragan 2012). This technique combines two-photon microscopy with moving stage and microtome to (1) expose the new blockface surface of the agarose-embedded brain sample by microtome slicing, (2) image the surface view by two-photon imaging (3) repeat imaging until the stage movement covers the entire surface, (4) go back to (1). This way, the entire marmoset brain was sliced into 650+ coronal sections at 50µm intervals, with 1.3µm xy resolution.
2: Image Processing (segmentation)
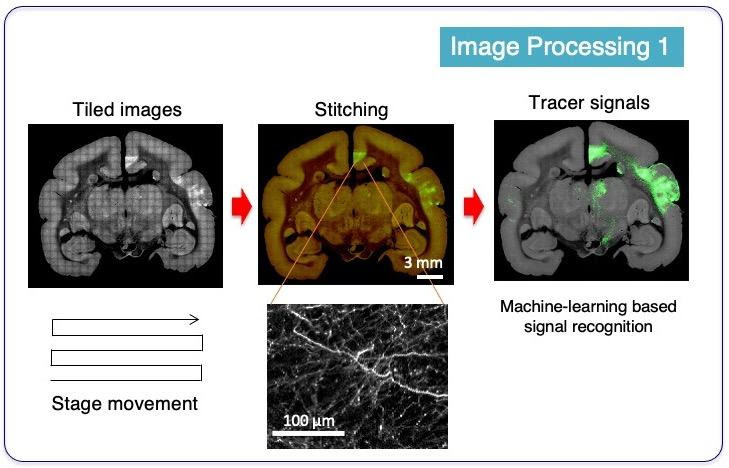
After STPT imaging, tens of thousands of raw images were fed into an image processing pipeline, which transforms the raw fluorescent images into meaningful dataset. Since each image constitutes only a part of the entire blockface surface, it needs to be tiled and stitched together after illumination correction to reproduce the high-resolution surface view. One of the most important analysis step is the recognition of tracer signals out of the tissue background. This step is called “segmentation”. Accurate segmentation of the tracer signals was achieved by implementation of machine-learning technique, which distinguished axon signals from sometimes strong background signals based on color and shape information.
3: Image Processing (registration)
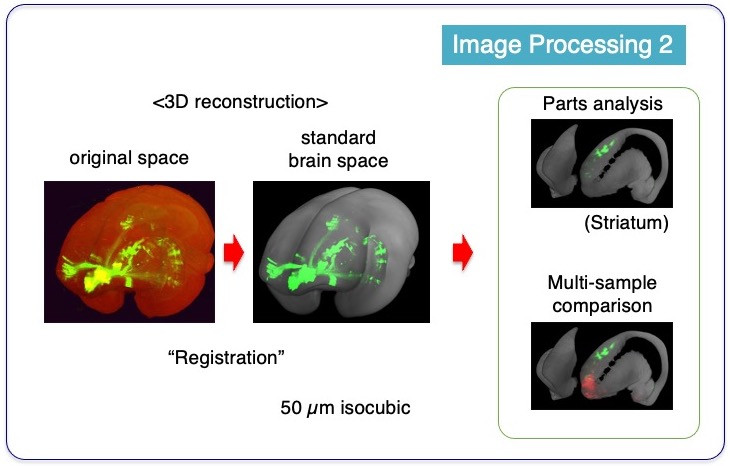
Another critical image processing step is “Registration”. Registration is an image processing technique that aligns similar but different shapes into a common shape in register. Individual marmoset brains all look similar but always slightly different from each other. To compare the results of data obtained from different marmosets, it is necessary to transform individual data to a common form. Registration process makes that possible. By averaging STPT imaging data from 25 individual brains, we made a “standard brain space” with 50 µm-isocubic resolution, which is coarser than the original resolution but still retains enough details. After registration of the 3D reconstructed image to the reference space, it becomes possible, for example, to take anatomical parts out of the entire brain for more detailed analysis or to compare different samples in the same space coordinates.
4: Online Viewers for Data Exploration
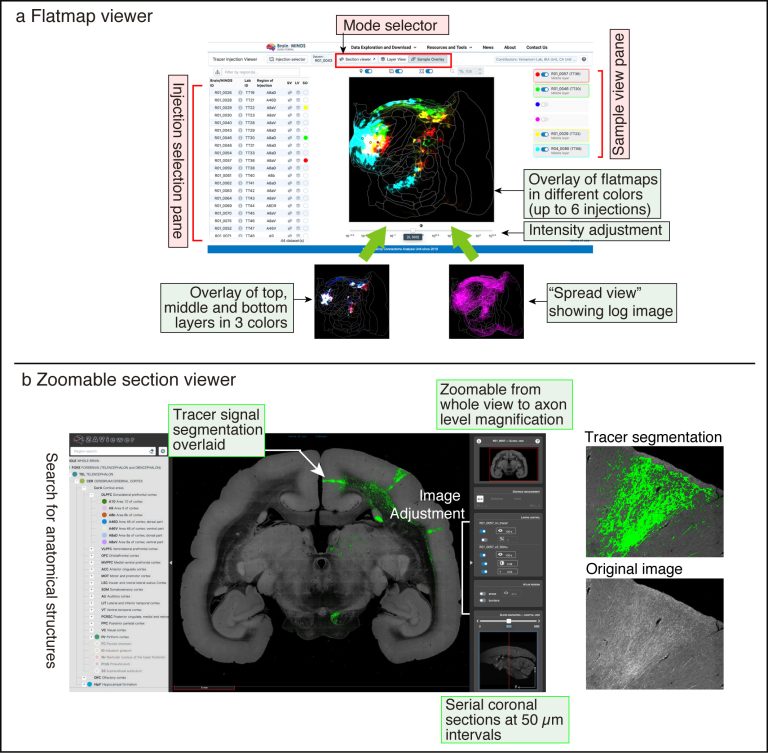
a: Flatmap viewer for visualization of flatmap data; there are three buttons for “Mode selector.” “Section Viewer” opens the Zoomable section viewer. “Layer view” shows the layer structures of the selected sample in three colors or the spread view of log-transformed low threshold image (shown below). “Sample overlay” shows the overlay of multiple samples with different colors (up to six samples).
b: Zoomable section viewer shows the original fluorescent image and tracer segmentation for all serial coronal sections of the entire brain. Segmented tracer signals are readily visible at low magnification and can be smoothly magnified to show axon-level details.
5: Connection matrix
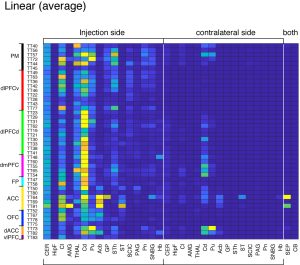
The connection matrices provided on this website show you summaries of the projection intensities in various anatomical regions that originated from 44 injections. We provide these matrices as an aid to (1) find regions that receive projections from the injection of interest and (2) find injections that send projections to the region of interest. Jump to Connection Matrix page.