Gene Expression Connectivity Mapping
Introduction
We are creating a new resource that allows public access to ISH gene expression data of the adult (and also newborn) marmoset in the same 3D brain reference space. The overall goal is to connect gene expression data collected within the brain minds project (https://gene-atlas.brainminds.jp/) with neural tracer data and connectivity data obtained from dMRI measurements.
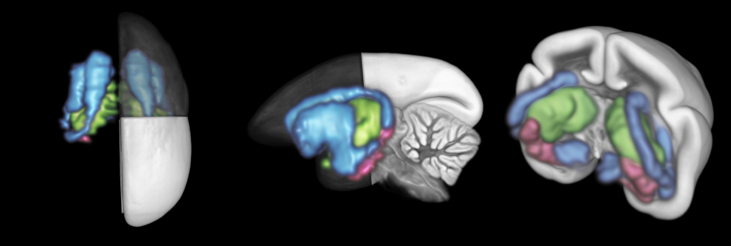
A 3D rendering of the processed imaging data of the three ISH gene expression data shown in the video on the right.
An animation of three genes from ISH expression data images combined with an anterograde neural tracer in the adult marmoset brain after segmentation, registration, and integration into BMCA standard space.
(DRD2: blue, TGFB2: green, C1QL2: pink).
Available soon
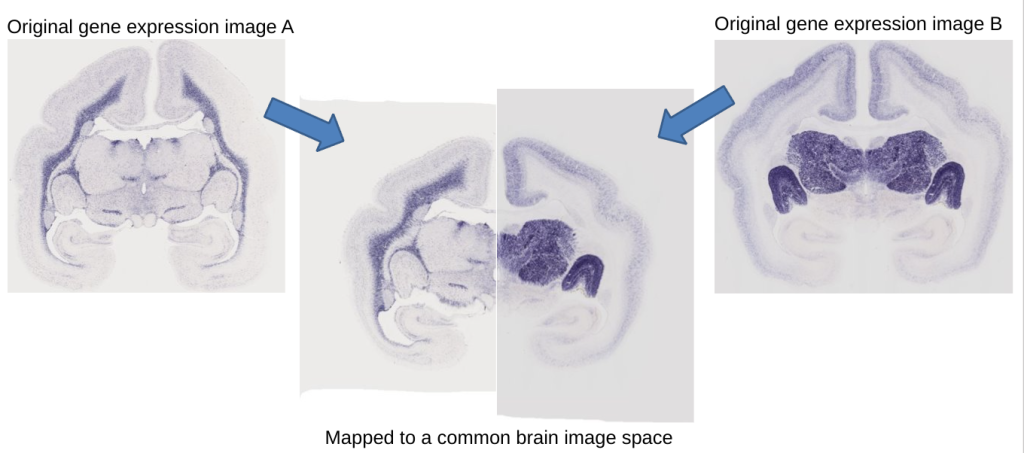
We are working on the integration of over 1000 genes from images of newborn marmosets, and also the integration of genes from the adult marmoset brain. A major challenge is that each gene has its own visual characteristics, which demands new methods for the automated alignment of different genes. The example below shows the different shape and features of two image sections taken from two different (newborn) marmoset brains.
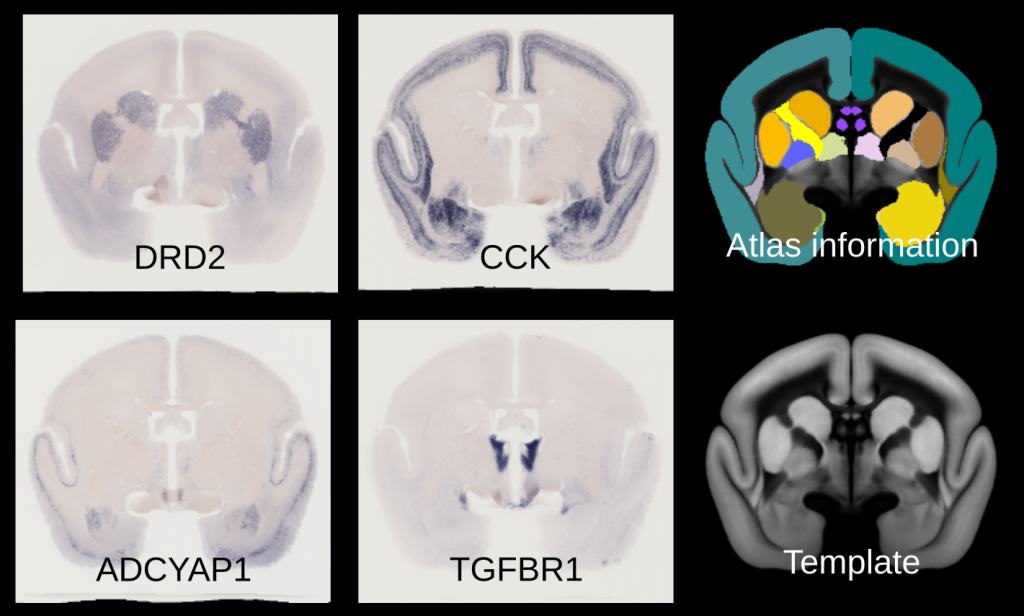
The image below shows four different gene expression patterns taken from adult marmoset brains. All data has been aligned to a reference common space. The template and atlas on the right are based on annotations and images based on serial two-photon microscopy (Watakabe 2021).
Goals
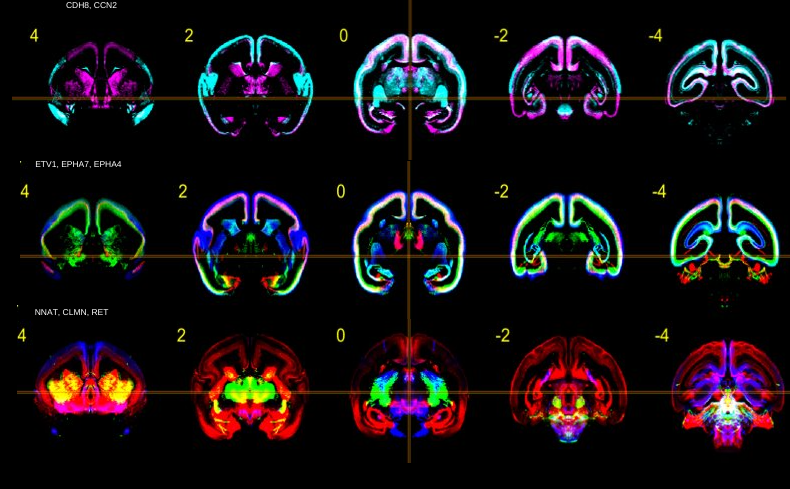
The image above shows various gene expression patterns in brains of newborn marmosets. A different color has been assigned to each gene expression. Different genes can be visually compared and explored simultaneously, because all data has been aligned to a common reference image.
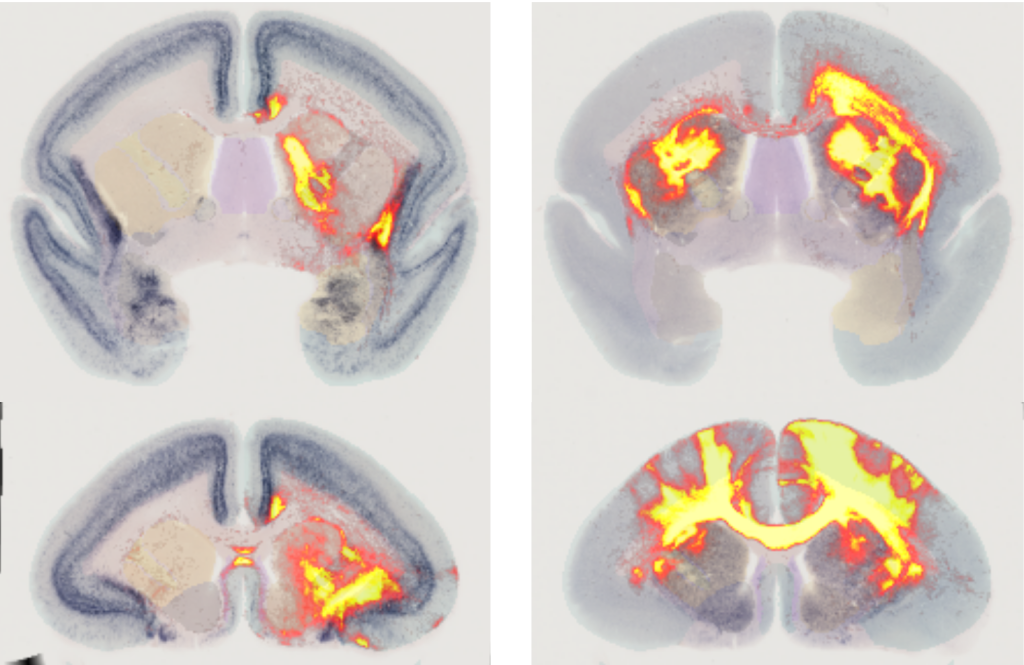
The example here shows a combination of gene expressions and anterograde neural tracers. All data has been aligned to a common brain image reference space. The right column shows gene expression DRD2 in combination with an anterograde tracer injected into A6M, the left column shows CCK with tracer injected into A13L. The tracer images are part of the work by Watakabe 2021.
Data samples
In preparation
Processing pipeline
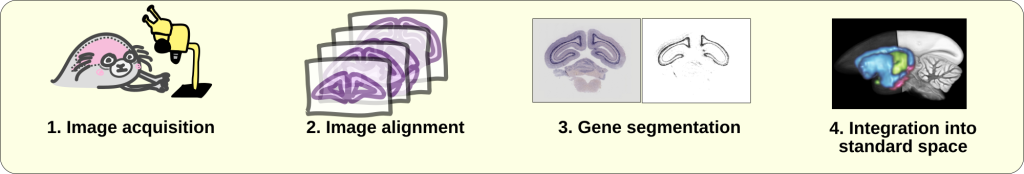
Gene expression brain atlases in lower-order model organisms, such as the Allen Mouse Brain Atlas, are widely used in neuroscience research. Primate brain atlases are necessary to facilitate understanding human development and disease. The Marmoset Gene Atlas created by the Brain/MINDS project in Japan, is an ISH database of gene expression in the marmoset brain. We are working on image segmentation, registration, and integration into standard space, which is needed for quantification and mapping of gene expression to a 3D atlas. We prioritize the automation of this analysis pipeline by using deep learning methods to reduce human error and bias.
Acquisition and image registration
The overall goal of image registration is to align brain images to a common template space.
Registration of brain images to a common template space facilitates better spatial understanding of gene expression and enables integration of data from different imaging modalities such serial two-photon tomography images, MRI. In other words, gene expression data from a single animal can be registered to an anatomically correct space, and data from different marmosets, acquired by different research centers, can be combined to facilitate a more holistic understanding of the marmoset brain (Skibbe et al., 2022). We describe the alignment of ISH images obtained from brain sections taken from 1 single marmoset. Image registration was performed in the opposite direction as image acquisition (Fig. 2). Three image modalities were collected:
- blockface (photo of the face of the frozen brain, before slicing),
- backlit (brain section), and
- ISH (brain section processed and stained).
- and dMRI
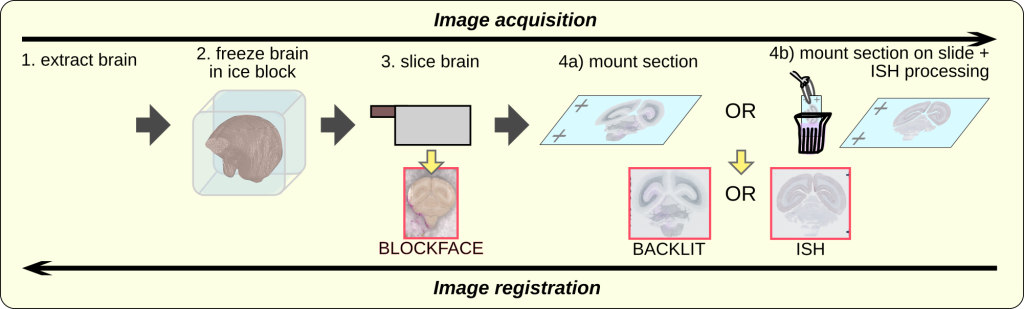
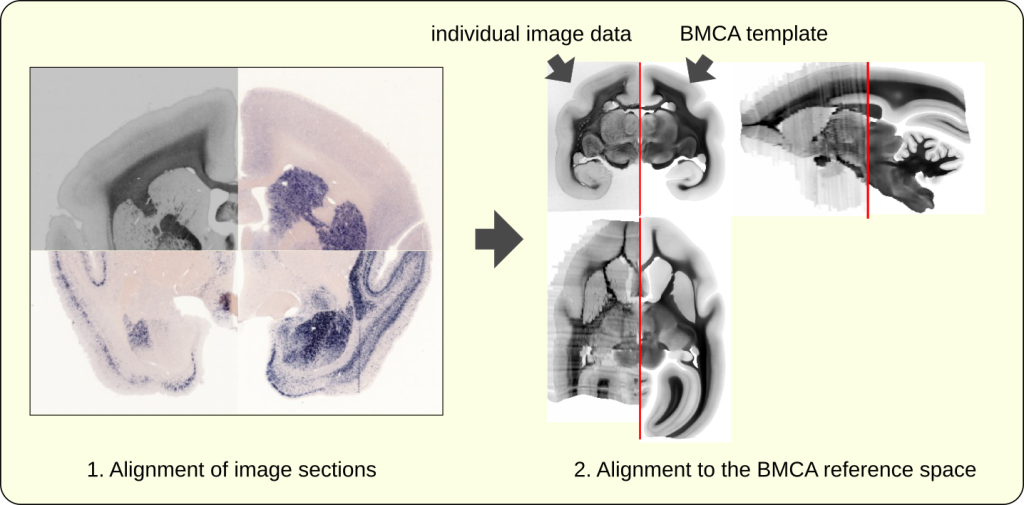
We use image registration techniques to determine the optimal shape and position of single image sections within one subject, and to map the result to an anatomically-correct adult marmoset template space. A combination of various imaging modalities helps to reconstruct a 3D volumetric image from 2D image sections of gene expressions (See image above). The image below shows three different gene expression images in combination with a backlit image. The right part shows the backlit image after it has been mapped to a reference space in tandem with the backlit template image.
Related publications:
- An automated pipeline to create an atlas of in situ hybridization gene expression data in the adult marmoset brain
C. Poon, M.F. Rachmadi, M. Byra, M. Schlachter, B. Xu, T. Shimogori, H. Skibbe
In IEEE International Symposium on Biomedical Imaging, to appear. - Semi-supervised semantic segmentation of in situ hybridization gene expression in the marmoset brain; C. Poon, M.F. Rachmadi, M. Byra, T. Shimogori, and H. Skibbe; Society for Neuroscience, 2022. (California, USA) (accepted)
- Semi-supervised contrastive learning for semantic segmentation of in situ hybridization gene expression in the marmoset brain; C. Poon, M.F. Rachmadi, M. Byra, T. Shimogori, and H. Skibbe; International Symposium on Artificial Intelligence and Brain Science, 2022. (Okinawa, Japan)
- Semi-supervised contrastive learning for semantic segmentation of in situ hybridization gene expression in the marmoset brain; C. Poon, M.F. Rachmadi, M. Byra, T. Shimogori, and H. Skibbe; Neuroscience, 2022. (Okinawa, Japan)
- Connectional architecture of the prefrontal cortex in the marmoset brain. Watakabe., A, Skibbe, H., Nakae, K., Abe, H., Ichinohe, N., Wang, J., Takaji, M., Mizukami, H., Woodward, A., Gong, R., Hata, J., Okano, H., Ishii, S. & Yamamori., T. bioRxiv 2021.12.26.474213; doi: https://doi.org/10.1101/2021.12.26.474213
- Cellular-resolution gene expression profiling in the neonatal marmoset brain reveals dynamic species-and region-specific differences; Kita, Y., Nishibe, H., Wang, Y., Hashikawa, T., Kikuchi, S. S., Mami, U,. Yoshida, A. C., Yoshida, C., Kawase, T., Ishii, S., Skibbe, H. and Shimogori, T. In Proceedings of the National Academy of Sciences, National Acad Sciences, volume 118, 2021.
Contact: The content of this page is maintained by the Brain Image Analysis Unit, Riken CBS. Please feel free to contact us with any questions or comments about the content. Contact information can be found on our homepage: https://bia.riken.jp/.